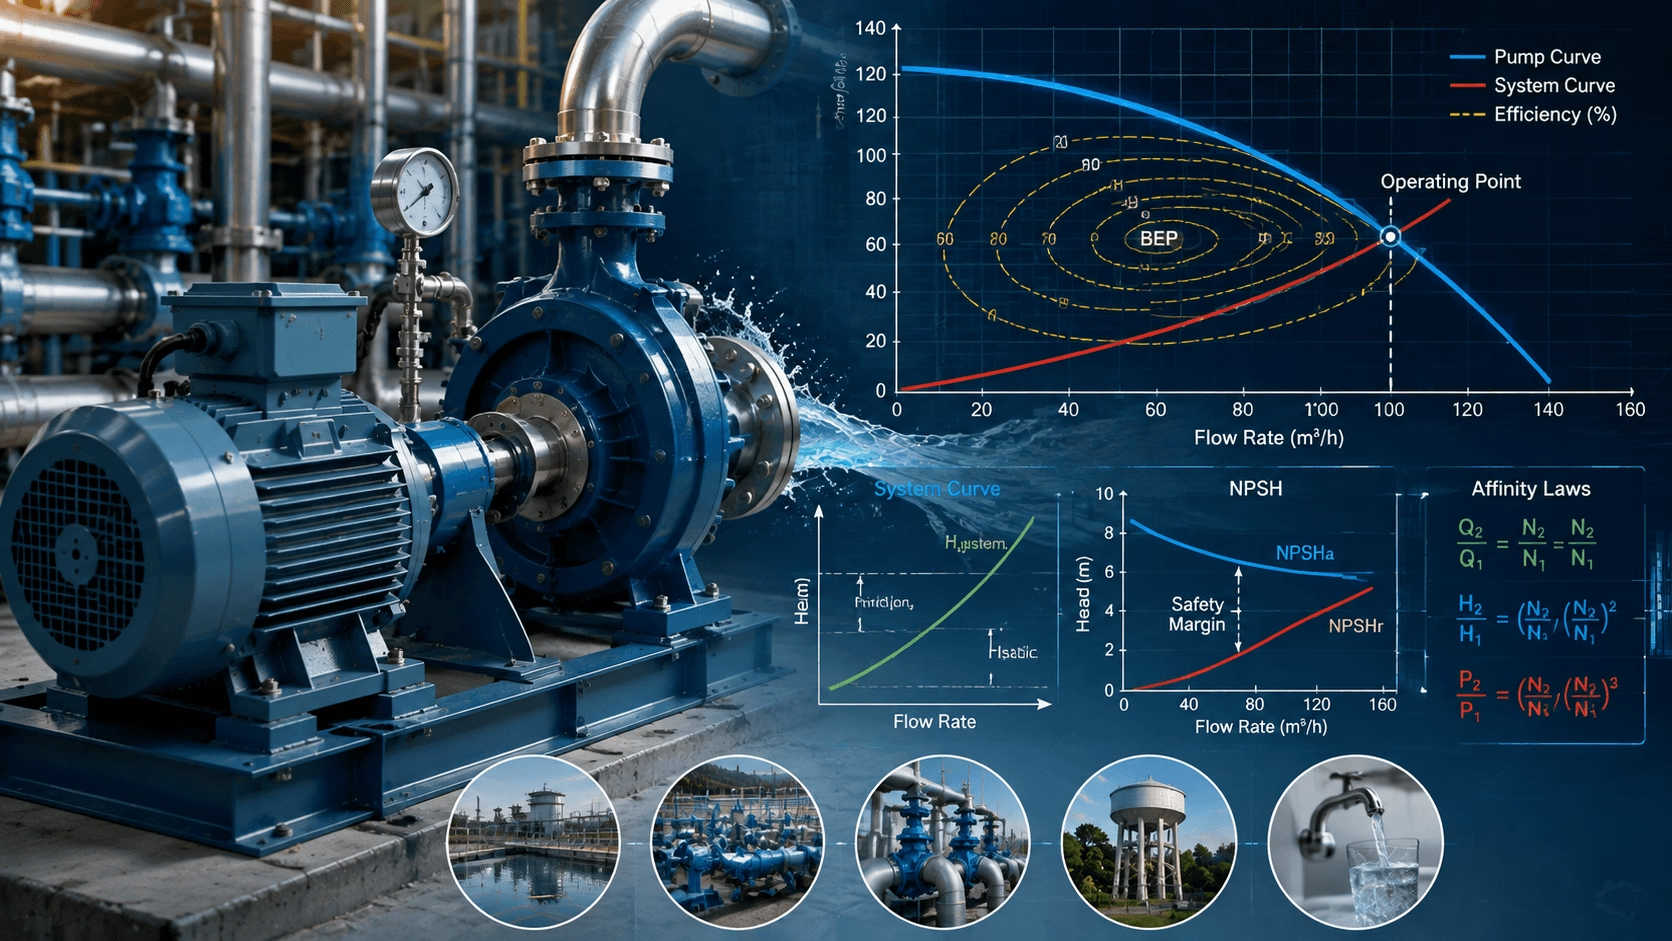
Understanding Pump Curves: Head, Flow, and Efficiency Explained
Abstract: A technical guide to reading and interpreting centrifugal pump performance curves. This article explains the fundamental relationships between head, flow, efficiency, system resistance, NPSH, and affinity laws, providing engineers with the knowledge required for optimal pump selection and reliable system design.
1. Introduction: The Language of Fluid Dynamics
Pump selection extends far beyond matching pipe diameters; it requires a rigorous understanding of fluid dynamics. The Pump Performance Curve is the primary engineering tool used to predict how a specific pump will behave within a defined system. Misinterpreting this data frequently results in energy waste, premature equipment failure, and inadequate system performance.
This guide decodes the technical parameters of pump curves, clarifying the critical interdependencies between head, flow rate, hydraulic efficiency, and system characteristics.
2. Fundamental Axes: Head and Flow
Every centrifugal pump curve plots two independent variables that define hydraulic performance:
- Flow Rate (Q): The volumetric quantity of liquid moved per unit time (e.g., m³/h or GPM). Represented on the horizontal axis.
- Total Dynamic Head (H): The total mechanical energy added to the fluid by the pump, expressed as an equivalent column height (meters or feet). This encompasses static lift, pressure differential, and friction losses. Represented on the vertical axis.
Inverse Relationship: In centrifugal pumps, head and flow are inversely related. As flow rate increases, available head decreases. A pump cannot simultaneously deliver maximum flow and maximum head; these represent opposite extremes of the performance envelope.
3. The System Resistance Curve
A pump does not operate in isolation; its actual operating point is determined entirely by the connected piping system. The System Curve quantifies total hydraulic resistance as a function of flow.
Components of System Head
H_system = H_static + H_friction
| Component | Definition | Flow Dependency |
|---|---|---|
| Static Head | Vertical elevation difference plus pressure differential between source and destination | Constant (independent of flow) |
| Friction Head | Energy loss due to fluid viscosity interacting with pipes, valves, and fittings | Proportional to Q² |
Operating Point
The pump will always operate at the intersection of the Pump Curve and the System Curve. This equilibrium point determines actual delivered flow and head. Shifting either curve (via valve throttling, speed change, or system modification) moves the operating point accordingly.
4. Best Efficiency Point (BEP)
Every centrifugal pump has a unique operating condition where hydraulic losses are minimized and energy conversion is maximized. This is the Best Efficiency Point (BEP).
Operational Zones Relative to BEP
| Zone | Hydraulic Behavior | Mechanical Consequence |
|---|---|---|
| At BEP | Smooth, attached flow through impeller passages | Minimal vibration, optimal bearing/seal life |
| Left of BEP (Low Flow) | Internal recirculation, flow separation | Heat buildup, shaft deflection, cavitation damage |
| Right of BEP (High Flow) | Increased turbulence, higher inlet velocity | Elevated NPSHr, motor overload risk, erosion |
Engineering Recommendation: For maximum reliability and lifecycle value, specify pumps such that the normal operating point falls within ±10% of BEP. Sustained operation outside ±20% of BEP significantly accelerates wear and increases failure probability.
5. Efficiency Contours ("Efficiency Islands")
Pump performance curves typically overlay iso-efficiency contour lines resembling topographical maps.
- Peak Efficiency: Located at the center of the innermost contour, coinciding with BEP.
- Acceptable Operating Window: Defined by the outer contours where efficiency remains within an acceptable percentage of peak (typically ≥80% of BEP efficiency).
- Off-Design Penalty: Efficiency degrades rapidly outside the acceptable window, directly increasing energy cost per unit volume pumped.
Selecting a pump whose system curve intersects the high-efficiency island ensures optimal energy utilization across expected operating conditions.
6. Net Positive Suction Head (NPSH): Cavitation Prevention
NPSH defines the suction-side pressure margin required to prevent phase change within the pump.
Critical Definitions
| Parameter | Description | Determined By |
|---|---|---|
| NPSHa (Available) | Absolute pressure at pump suction flange minus vapor pressure | System installation, tank level, pipe friction, fluid temperature |
| NPSHr (Required) | Minimum pressure needed at impeller eye to prevent 3% head drop from cavitation | Pump geometry and operating point (from manufacturer curve) |
Mandatory Design Rule
NPSHa > NPSHr + Safety Margin
Where safety margin is typically 0.5–1.0 m minimum, or per industry standards (e.g., HI 9.6.1).
Cavitation Mechanism: When local pressure drops below fluid vapor pressure, vapor bubbles form and subsequently collapse violently upon reaching higher-pressure regions. This causes impeller pitting, noise, vibration, and catastrophic performance degradation.
7. Affinity Laws: Variable Speed Performance Prediction
When pump rotational speed changes (e.g., via VFD), performance parameters scale according to the Affinity Laws:
Q₂ / Q₁ = N₂ / N₁
H₂ / H₁ = (N₂ / N₁)²
P₂ / P₁ = (N₂ / N₁)³
Where Q = Flow, H = Head, P = Power, N = Rotational Speed.
Critical Implication: Power consumption varies with the cube of speed. A 20% speed reduction yields approximately 49% power savings. This cubic relationship forms the scientific foundation for VFD-based energy optimization in variable-demand pumping systems.
8. Conclusion
Proficiency in interpreting pump curves is non-negotiable for efficient hydraulic system design. By correctly matching pump performance to system resistance, ensuring operation near BEP, verifying adequate NPSH margin, and leveraging affinity laws for variable-speed applications, engineers can achieve reliable, energy-efficient, and mechanically robust pumping systems.
Fluid dynamics is not abstract theory—it is the practical engineering discipline that determines whether a pumping installation succeeds or fails over its operational lifetime.
Optimize Your Pumping System
TITECHO provides precision-engineered pumps and motors with comprehensive performance documentation to support accurate system design.
- Explore TITECHO Pumps & Motors: www.cntecho.com
- Consult Our Engineering Team: [email protected]