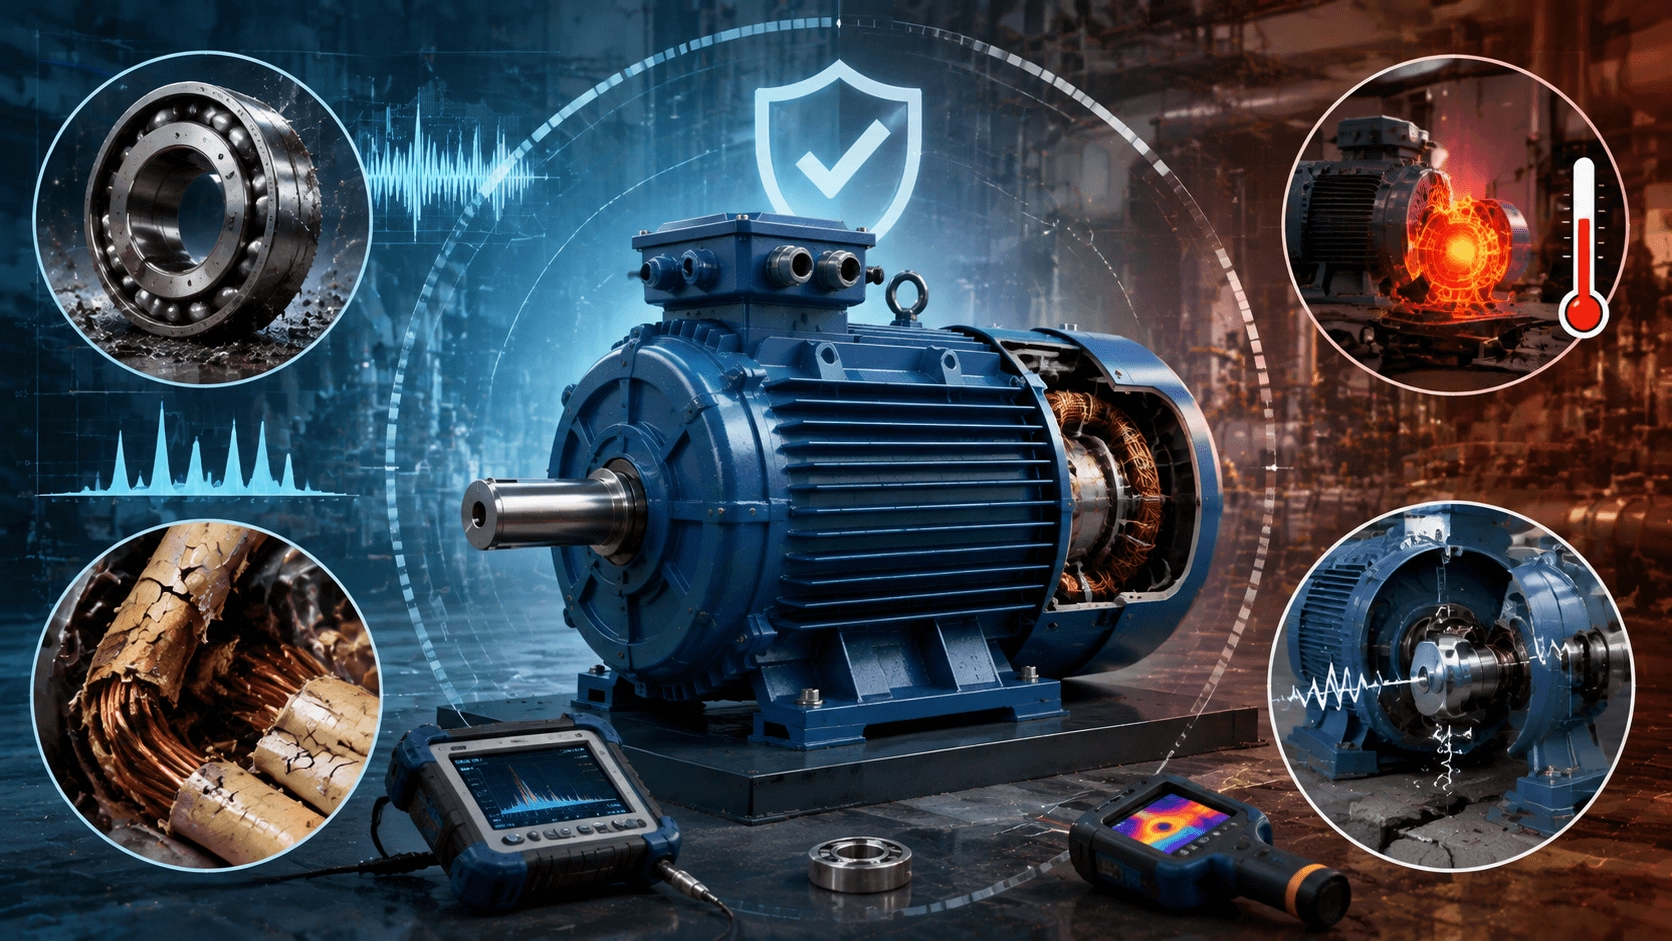
A comprehensive technical guide to the most prevalent motor failure mechanisms—bearings, insulation degradation, overload conditions, and excessive vibration—encompassing diagnostic methodologies and preventive strategies that significantly extend motor service life. Expert reliability engineering guidance from Techo Electrical & Mechanical (Titecho).
1. Introduction
Electric motors rank among the most reliable machines in industrial service, with design lifespans frequently exceeding 20 years under ideal operating conditions. However, field data consistently demonstrates that the majority of motor failures are not attributable to intrinsic design deficiencies but rather to external stressors, improper application, and inadequate maintenance protocols.
Studies conducted by IEEE, EPRI, and major motor manufacturers indicate that bearings, insulation degradation, overload conditions, and excessive vibration collectively account for over 80% of all motor failures. Understanding the root causes of these failure mechanisms—and implementing systematic prevention strategies—can extend motor life by 2–3×, reduce unplanned downtime by 60–70%, and reduce lifecycle costs by 40% or more.
This guide provides engineers and maintenance professionals with actionable diagnostic and preventive frameworks for the four dominant motor failure mechanisms.
2. Bearing Failures: The Leading Cause of Motor Downtime
2.1 Failure Mechanisms and Root Causes
Bearing failures account for approximately 50–65% of all motor failures in industrial applications. The primary mechanisms are summarised below:
| Failure Mode | Root Cause | Typical Symptoms | Time to Failure |
|---|---|---|---|
| Fatigue spalling | Cyclic Hertzian contact stress exceeding material endurance limits | Vibration at BPFO/BPFI frequencies; metal particles in grease | Months to years |
| Lubrication failure | Incorrect grease type, quantity, or contamination; thermal degradation | Temperature rise; acoustic noise; increased friction torque | Weeks to months |
| Contamination | Ingress of dust, moisture, or process chemicals | Abrasive wear; corrosion pitting; discoloured grease | Days to months |
| Misalignment | Angular or parallel offset between motor and driven shaft | High vibration at 1× and 2× running speed; elevated axial vibration | Months |
| Electrical pitting (EDM) | Shaft currents induced by VFD common-mode voltage | Fluting (washboard pattern) on raceways; discrete pitting | Weeks to months |
| Brinelling | Static overload; improper transport or storage handling | Permanent indentations on raceways; rough rotation | Immediate |
2.2 Diagnostic Techniques
Vibration Analysis
Bearing defect frequencies are calculated using the following text-based formulas:
BPFO = (Nb / 2) × fr × (1 − (d / D) × cos(β))
(Ball Pass Frequency, Outer Race)
BPFI = (Nb / 2) × fr × (1 + (d / D) × cos(β))
(Ball Pass Frequency, Inner Race)
BSF (Ball Spin Frequency): Indicates rolling element defects.
FTF (Fundamental Train Frequency): Indicates cage-related defects.
Where:
- Nb = Number of rolling elements
- fr = Rotational frequency (Hz)
- d = Rolling element diameter
- D = Pitch diameter of the bearing
- β = Contact angle
Temperature Monitoring
- Bearing operating temperature should generally not exceed 80°C (176°F) for standard greases, or 110°C (230°F) for high-temperature synthetic lubricants.
- A 15°C temperature rise above baseline frequently indicates incipient lubrication degradation or mechanical distress.
Grease Analysis
- Fourier Transform Infrared (FTIR) spectroscopy identifies chemical breakdown and oxidation.
- Ferrography quantifies wear particle concentration and morphology to assess internal component health.
2.3 Prevention Strategies
| Strategy | Implementation | Expected Impact |
|---|---|---|
| Correct lubrication | Utilise manufacturer-specified grease; apply 30–50% of bearing cavity free volume | Extends bearing life 2–3× |
| Sealed/for-life bearings | Pre-lubricated and sealed at factory; eliminate relubrication errors | Reduces contamination risk by 80% |
| Shaft current mitigation | Insulated bearings + shaft grounding ring for VFD applications | Eliminates EDM pitting |
| Precision alignment | Laser alignment to < 0.05 mm/m angular and < 0.1 mm parallel offset | Reduces bearing load by 30–50% |
| Vibration monitoring | Continuous monitoring with alarm thresholds (ISO 10816 standards) | Enables predictive replacement |
3. Insulation Degradation: The Silent Killer
3.1 Insulation System Stressors
Motor insulation is subjected to a combination of thermal, electrical, mechanical, and environmental stresses—collectively known as the "TEAM" model:
| Stressor | Mechanism | Acceleration Factor |
|---|---|---|
| Thermal | Arrhenius reaction rate: insulation life halves per 10°C rise above rated temperature | Operating temperature |
| Electrical | Partial discharge in voids; corona at conductor edges | Voltage stress (V/μm) |
| Mechanical | Thermal cycling causes differential expansion; vibration abrades insulation | Thermal cycling frequency |
| Environmental | Moisture, chemicals, oil contamination reduce dielectric strength | Humidity, chemical exposure |
3.2 Failure Progression
Insulation failure typically progresses through five distinct stages:
- Stage 1 – Chemical Degradation: Thermal ageing cross-links polymer chains, reducing flexibility and dielectric resilience.
- Stage 2 – Void Formation: Outgassing and material shrinkage create microscopic air pockets within the insulation system.
- Stage 3 – Partial Discharge: Corona activity within voids progressively erodes insulation material.
- Stage 4 – Tracking: Carbonised conductive paths form between adjacent conductors.
- Stage 5 – Ground Fault or Inter-Turn Short: Catastrophic electrical failure occurs.
3.3 Diagnostic Techniques
Insulation Resistance (IR) Testing
- Megohm measurement at 500V or 1000V DC.
- Minimum acceptable value: 1 MΩ + 1 MΩ per kV of rated voltage.
- Polarisation Index (PI): IR at 10 minutes / IR at 1 minute. A PI < 2.0 indicates moisture ingress or contamination.
Partial Discharge (PD) Testing
- Measures corona activity in pico-coulombs (pC).
- Online PD monitoring detects incipient failure without requiring shutdown.
- PD > 1000 pC at rated voltage indicates actionable degradation requiring intervention.
Dissipation Factor (Tan δ)
- Measures dielectric losses within the insulation system.
- Increasing tan δ values indicate moisture ingress or progressive thermal ageing.
3.4 Prevention Strategies
| Strategy | Implementation | Expected Impact |
|---|---|---|
| Thermal management | Operate within insulation class limits (Class F: 155°C; Class H: 180°C) | Each 10°C reduction doubles insulation life |
| VFD output filtering | Install dV/dt filters or sinewave filters for cable runs > 50 m | Reduces voltage stress by 40–60% |
| Inverter-grade insulation | NEMA MG-1 Part 31 or IEC 60034-18-41 compliance | Prevents turn-to-turn failure |
| Environmental sealing | IP55 or IP65 enclosures; maintain breather and drain integrity | Eliminates moisture ingress |
| Offline testing programme | Annual PI and IR testing; biennial PD testing | Detects degradation 2–5 years before failure |
4. Overload and Thermal Damage
4.1 Overload Mechanisms
| Overload Type | Cause | Thermal Impact |
|---|---|---|
| Mechanical overload | Pump jam, bearing seizure, process upset | Stator current exceeds rated value; I²R losses increase with current² |
| Voltage imbalance | Single-phasing, poor connections, utility issues | Negative-sequence currents induce rotor heating |
| Frequent starting | Excessive starts per hour exceed thermal limits | Rotor bars experience thermal cycling; cumulative heating |
| High ambient temperature | Inadequate ventilation; adjacent heat sources | Reduced heat rejection capability |
| Low voltage | Undersized supply; long cable runs | Current increases to maintain power; I²R losses rise |
4.2 The Voltage Imbalance Problem
Voltage imbalance is particularly destructive because it generates negative-sequence currents that rotate opposite to the rotor field, inducing double-frequency currents (100 Hz at 50 Hz supply) in the rotor. The derating requirements are severe:
| Voltage Imbalance | Required Derating | Rotor Heating Increase |
|---|---|---|
| 1% | None | Moderate |
| 2% | 5% | Significant |
| 3% | 15% | Severe |
| 4% | 25% | Critical |
| 5% | 30% | Failure imminent |
Engineering Rule: Investigate and correct any voltage imbalance exceeding 1%, measured as the maximum deviation from average voltage, divided by the average voltage.
4.3 Protection Strategies
| Protection Method | Setting / Implementation | Response Time |
|---|---|---|
| Overload relays (thermal) | 115% of FLA for Class 10; 125% for Class 20 | Seconds to minutes |
| Electronic overload relays | Programmable curves; phase-loss detection | < 5 seconds |
| RTD/thermistor protection | 140°C alarm; 155°C trip (Class F) | Seconds |
| Current differential | Compares phase currents; detects internal faults | < 100 ms |
| Intelligent motor protection relays | Model-based thermal replica; learns motor thermal time constants | Adaptive |
Critical Practice: Size overload protection based on the motor nameplate FLA (Full Load Amps), not the service factor. The service factor (typically 1.15) represents a temporary overload capability, not a continuous operating rating.
5. Vibration: The Universal Symptom
5.1 Vibration Sources and Frequencies
Vibration is not a root cause but rather a symptom of underlying mechanical or electromagnetic issues:
| Frequency Component | Source | Diagnostic Significance |
|---|---|---|
| 1× running speed | Unbalance, misalignment, bent shaft, looseness | Most common; indicates mechanical issues |
| 2× running speed | Misalignment (especially angular), mechanical looseness | Strong indicator of coupling or bearing housing issues |
| Electrical line frequency (50/60 Hz) | Magnetic forces, rotor bar defects, eccentric air gap | Distinguishes electrical from mechanical faults |
| Slot pass frequency | Rotor slot passing stator slots; manufacturing tolerances | High amplitude indicates rotor/stator interaction |
| Bearing frequencies | BPFO, BPFI, BSF, FTF | Specific bearing defect identification |
| Sub-synchronous (< 1×) | Oil whirl, looseness, rubs | Critical for sleeve bearings; indicates instability |
5.2 Vibration Severity Standards
ISO 10816 provides vibration velocity limits (mm/s RMS) for different machine classes:
| Machine Class | Small Machines (< 15 kW) | Medium Machines (15–75 kW) | Large Machines (> 75 kW) |
|---|---|---|---|
| Zone A (Good) | < 1.4 | < 2.3 | < 2.8 |
| Zone B (Acceptable) | 1.4–2.8 | 2.3–4.5 | 2.8–7.1 |
| Zone C (Unsatisfactory) | 2.8–4.5 | 4.5–7.1 | 7.1–11.2 |
| Zone D (Unacceptable) | > 4.5 | > 7.1 | > 11.2 |
5.3 Vibration Prevention and Mitigation
| Strategy | Implementation | Impact |
|---|---|---|
| Precision balancing | Balance to ISO 1940 G2.5 or better; field trim balance | Reduces 1× vibration by 70–90% |
| Laser alignment | Align to < 0.05 mm/m; check soft foot distortion | Eliminates 2× component |
| Structural stiffness | Ensure baseplate/grout integrity; avoid structural resonance | Prevents vibration amplification |
| Electrical verification | Check rotor bars, air gap eccentricity, voltage imbalance | Distinguishes electrical vs. mechanical faults |
| Continuous monitoring | Accelerometers with trending software; alarm/action limits | Enables condition-based maintenance |
6. Integrated Predictive Maintenance Strategy
6.1 Condition Monitoring Technologies
| Technology | Detects | Cost | Implementation |
|---|---|---|---|
| Vibration analysis | Mechanical faults, bearing defects, misalignment, unbalance | Medium | Monthly route-based or continuous online |
| Motor Current Signature Analysis (MCSA) | Rotor bar defects, air gap eccentricity, load variations | Low | Non-invasive; utilises existing CTs |
| Thermal imaging | Connection hot spots, bearing overheating, insulation hot spots | Low | Quarterly inspections |
| Partial discharge monitoring | Insulation degradation in windings | High | Online for critical motors; offline for others |
| Oil/grease analysis | Bearing wear, lubricant degradation, contamination | Medium | Quarterly sampling |
| Shaft voltage monitoring | Bearing current activity (VFD applications) | Low | Permanent installation for large motors |
6.2 Failure Mode Prioritisation Matrix
| Failure Mode | Probability | Severity | Detectability | Risk Priority | Primary Prevention |
|---|---|---|---|---|---|
| Bearing failure | High | High | Medium | 1 | Lubrication programme, alignment, shaft current mitigation |
| Insulation failure | Medium | Very High | Medium | 2 | Thermal management, VFD filtering, offline testing |
| Overload/thermal | Medium | High | High | 3 | Proper protection, voltage monitoring, load management |
| Vibration damage | High | Medium | High | 4 | Balancing, alignment, structural integrity |
6.3 Maintenance Strategy Evolution
| Stage | Approach | Characteristics | Cost Impact |
|---|---|---|---|
| Reactive | Run-to-failure | No planning; highest downtime cost | Baseline (highest) |
| Preventive | Time-based overhaul | Fixed intervals; may replace serviceable components | −20–30% vs. reactive |
| Predictive | Condition-based action | Data-driven; repair only when indicated | −40–50% vs. reactive |
| Proactive | Root cause elimination | Design out failure modes; continuous improvement | −60–70% vs. reactive |
7. Design-for-Reliability Considerations
7.1 Specification Checklist for Critical Applications
| Parameter | Specification | Rationale |
|---|---|---|
| Insulation system | Class H with VPI; inverter-duty if VFD-fed | 25°C thermal margin; void-free impregnation |
| Bearing configuration | Regreasable bearings with relief port; L10 life > 100,000 hours | Maintainability; extended service interval |
| Cooling | IC411 (TEFC) minimum; IC416 for VFD or high ambient | Ensures thermal performance across all operating points |
| Protection | RTDs in windings; thermistors; space heaters for standby | Comprehensive thermal and environmental protection |
| Enclosure | IP55 minimum; IP65 for washdown/harsh environment | Contamination exclusion |
| Shaft | 4140 steel; ground and polished; NDE access | Fatigue resistance; vibration measurement access |
7.2 Installation Best Practices
- Foundation: Mass should be 3–5× motor mass; grout must cure for 48 hours minimum before alignment.
- Alignment: Perform "soft foot" check; verify no frame distortion when mounting bolts are tightened.
- Electrical: Torque connections to manufacturer specification; verify voltage imbalance before energisation.
- VFD Commissioning: Set acceleration/deceleration ramps appropriate to load inertia; verify shaft voltage levels.
- Baseline Data: Record vibration spectrum, temperature, and current signature at commissioning for future comparison.
8. Conclusion
Motor failures are rarely sudden catastrophes; they represent the culmination of months or years of progressive degradation from identifiable and preventable stressors. Bearings fail due to lubrication errors, contamination, or electrical pitting. Insulation degrades from thermal ageing, voltage stress, and moisture ingress. Overload conditions—whether from mechanical jamming, voltage imbalance, or improper protection—accelerate thermal damage. Vibration, while often a symptom rather than a root cause, amplifies all other failure mechanisms through mechanical fatigue and loosening.
The engineering response must be systematic: implement precision installation practices, establish comprehensive condition monitoring programmes, specify motors with appropriate margins for the application environment, and transition from reactive to predictive maintenance strategies. The empirical evidence is compelling—facilities that implement comprehensive motor reliability programmes achieve 60–70% reduction in unplanned downtime and 40–50% lower total motor lifecycle costs.
In an era where motor assets represent millions of dollars in capital investment and energy consumption, prevention is not merely preferable to cure—it constitutes an engineering and economic imperative.
Reference Standards:
- Insulation Testing: IEEE 432
- Vibration Evaluation: ISO 10816
- Balancing: ISO 1940
- Motor Standards: NEMA MG-1
- Repair Practices: EASA AR100 (Recommended Practice for the Repair of Rotating Electrical Apparatus)
9. Engineered Reliability Solutions with Titecho
Techo Electrical & Mechanical (Taizhou) Co., Ltd. (Brand: Titecho) specialises in the design and manufacture of high-reliability three-phase AC induction motors engineered for demanding industrial applications. Our product portfolio features advanced insulation systems, precision bearing configurations, integrated thermal protection, and robust mechanical construction tailored to maximise uptime and minimise lifecycle costs.
We provide comprehensive engineering support, including failure mode analysis, condition monitoring integration guidance, installation best practices, and application-specific reliability optimisation to ensure superior motor performance and extended service life.
Explore technical data sheets, reliability specifications, and application engineering support at www.cntecho.com.
© Techo Electrical & Mechanical (Titecho) – Engineering Reliability Through Precision Motor Design