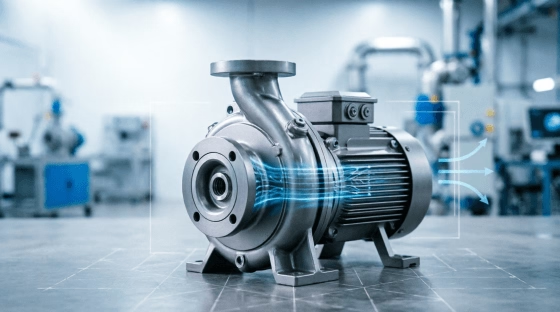
A Practical Step-by-Step Methodology to Evaluate Total Cost of Ownership Beyond Initial Purchase Price: Energy Modeling, Maintenance Quantification, Downtime Risk Assessment, and Sensitivity Analysis for Industrial Fluid Handling Systems
In industrial procurement, the initial purchase price of a motor or pump typically represents only 2–5% of its total lifecycle cost. Yet purchasing decisions remain disproportionately anchored to this minority expense, resulting in systematic overpayment through elevated energy consumption, premature failures, and unplanned downtime. Total Cost of Ownership (TCO) analysis corrects this distortion by quantifying all costs incurred from acquisition through disposal, enabling economically rational equipment selection aligned with operational and financial objectives.
This guide provides a rigorous, actionable TCO framework specifically calibrated for electric motors and industrial pumps. It integrates engineering physics with financial modeling to transform subjective vendor claims into verifiable, comparable economic metrics.
1. Why TCO Matters: The Economic Case for Lifecycle Thinking
The Iceberg Cost Structure
For a continuously operated 75 kW centrifugal pump system with a 15-year service life, typical cost distribution is:
| Cost Category | % of TCO | Notes |
|---|---|---|
| Energy Consumption | 70–85% | Dominant variable; sensitive to efficiency and load profile |
| Maintenance & Repair | 8–15% | Scheduled PM + unscheduled corrective actions |
| Unplanned Downtime | 3–10% | Highly application-dependent; can exceed energy savings in critical processes |
| Acquisition (Purchase Price) | 2–5% | Includes motor, pump, coupling, baseplate |
| Installation & Commissioning | 1–3% | Labor, electrical upgrades, alignment, testing |
| Disposal / Residual Value | <1% | Scrap recovery minus environmental compliance costs |
Strategic Implication: A 10% reduction in energy consumption delivers greater TCO impact than eliminating the entire purchase price. Optimizing for lowest bid systematically maximizes lifecycle expenditure.
Decision Quality and Stakeholder Alignment
TCO analysis bridges the gap between procurement (focused on capital expenditure) and operations/engineering (focused on operating expenditure). It provides a common quantitative language that:
- Justifies premium-efficiency investments to finance teams using NPV and IRR metrics.
- Validates vendor performance claims against independent calculation models.
- Supports sustainability reporting by linking equipment choices to energy and carbon outcomes.
- Reduces post-purchase regret and blame attribution when failures occur.
Regulatory and ESG Drivers
Emerging regulations (EU Ecodesign, US DOE, CSRD) increasingly mandate lifecycle cost disclosure or minimum efficiency thresholds that implicitly enforce TCO thinking. Investors and customers evaluate supply chain sustainability through Scope 2 emissions directly tied to motor-pump energy consumption. TCO documentation satisfies both commercial and compliance requirements simultaneously.
2. Step 1: Collect Accurate Duty Cycle Data
TCO accuracy is directly proportional to duty data fidelity. Generic assumptions produce misleading conclusions.
Essential Operating Parameters
- Annual Operating Hours: Actual runtime, not nameplate capacity hours. Use SCADA logs, VFD hour meters, or clamp meter surveys. Continuous (8,760 h/y), two-shift (4,000 h/y), and intermittent (<2,000 h/y) profiles yield radically different TCO rankings.
- Load Profile Distribution: Percentage of time at each load point (e.g., 20% at full load, 50% at 75%, 30% at 50%). Motor efficiency varies significantly across load range; weighted average efficiency must replace nominal nameplate values.
- Start/Stop Frequency: High cycling accelerates winding insulation fatigue, bearing wear, and mechanical seal degradation. Quantify cycles per day/week for maintenance interval adjustment.
- Fluid Properties: Viscosity, density, solids content, temperature, and corrosivity affect hydraulic power requirement, material selection, and seal/bearing life. Changes from design conditions invalidate catalog performance curves.
- System Head Curve: Actual installed system resistance versus pump design point. Oversized pumps operating far from BEP waste energy regardless of motor efficiency. System audit may precede equipment TCO comparison.
- Environmental Conditions: Ambient temperature, altitude, humidity, dust, and hazardous area classification influence cooling capability, derating factors, enclosure specifications, and maintenance frequency.
Data Collection Best Practices
- Prefer measured data over estimated or catalog values.
- Capture seasonal and production-cycle variations; avoid single-point snapshots.
- Document data sources, measurement uncertainty, and collection dates.
- For greenfield projects without historical data, use conservative sensitivity ranges rather than false precision.
3. Step 2: Model Energy Consumption with Engineering Rigor
Energy dominates TCO and warrants the most detailed modeling effort.
Baseline Energy Calculation
Annual energy consumption for a motor-driven pump is calculated as:
E_annual = (P_shaft × t_op) / η_motor
Where:
- P_shaft = Shaft power required at actual operating point (kW), derived from pump curve and system head intersection
- t_op = Annual operating hours at that load point
- η_motor = Motor efficiency at actual load and speed (not nameplate rated efficiency)
For variable-load applications, sum across all load bins:
E_total = Σ [(P_i × t_i) / η_i]
VFD Impact Modeling
Variable Frequency Drives fundamentally alter energy economics through affinity law relationships:
- Flow ∝ Speed: Q₂/Q₁ = N₂/N₁
- Head ∝ Speed²: H₂/H₁ = (N₂/N₁)²
- Power ∝ Speed³: P₂/P₁ = (N₂/N₁)³
A 20% speed reduction theoretically yields 49% power reduction. Real-world savings are lower due to:
- Static head component unaffected by speed reduction
- VFD conversion losses (typically 2–4%)
- Motor efficiency degradation at reduced frequency/speed
- System curve deviations from pure friction-dominated profiles
Always model actual system curves rather than assuming cubic savings. Measure or calculate static vs. dynamic head ratio to determine achievable savings ceiling.
Electricity Cost Structuring
Energy cost extends beyond volumetric kWh rates:
- Time-of-Use Tariffs: Weight consumption by period-specific rates; VFD scheduling can shift load to off-peak windows.
- Demand Charges: Peak kW billing based on highest 15-minute demand in billing period. Soft-start and load-shedding strategies reduce peak charges independently of volumetric savings.
- Power Factor Penalties: Low PF incurs surcharges; capacitor banks or active front-end VFDs mitigate.
- Escalation Assumptions: Apply realistic energy price growth projections (historical trend + policy outlook). Typical range: 2–5% annually. Avoid zero-escalation baselines that understate long-term savings.
Efficiency Class Comparison Protocol
When comparing IE-class motors:
- Use tested efficiency values per IEC 60034-2-1, not marketing claims.
- Account for partial-load efficiency differences; IE4 advantage narrows or widens depending on load profile.
- Include VFD-compatible motor derating if applicable.
- Validate that compared motors meet same torque, starting, and thermal requirements for the application.
4. Step 3: Quantify Maintenance and Downtime Costs
These categories exhibit highest variability and require application-specific calibration.
Scheduled Maintenance Costing
- Labor: Hours × fully burdened labor rate (wages + benefits + overhead). Include travel time for remote sites.
- Materials: Bearings, seals, lubricants, filters, gaskets at current replacement cost. Track consumption rates per operating hour or cycle.
- Contract Services: Specialized alignment, vibration analysis, oil analysis, rewinding. Annualize multi-year contracts.
- Preventive vs. Predictive Transition: PdM adoption reduces unnecessary PM but requires sensor/investment. Model transition period costs and steady-state savings separately.
Unplanned Downtime Valuation
Downtime cost is frequently underestimated or omitted entirely. Components include:
- Lost Production Revenue: Gross margin per hour × mean time to repair (MTTR). For bottleneck assets, use contribution margin of entire downstream process.
- Expedited Logistics: Premium freight, after-hours parts sourcing, emergency contractor mobilization.
- Overtime Labor: Premium wages for repair crews and catch-up production shifts.
- Quality/Yield Loss: Off-spec product during restart transients, scrap generation, rework costs.
- Safety/Environmental Incident Risk: Potential regulatory fines, cleanup costs, insurance premium impacts. Assign probability-weighted expected value for high-consequence scenarios.
- Customer Penalty Exposure: Contractual late-delivery penalties, SLA credits, reputational damage quantified through churn risk.
Reliability Data Sources
- Internal CMMS/EAM failure history (preferred; site-specific)
- Vendor MTBF claims (verify against independent field data; often optimistic)
- Industry benchmarks (OREDA, HSE RR, API reliability databases)
- Weibull analysis of age-to-failure distributions for remaining useful life estimation
Critical Practice: Always distinguish between mean time between failures (MTBF) and mean time to repair (MTTR). TCO sensitivity to MTTR often exceeds sensitivity to MTBF for critical assets. Invest in spares strategy and repair capability accordingly.
5. Step 4: Capture Installation and Commissioning Costs
Frequently overlooked, these upfront costs vary significantly between alternatives.
Direct Installation Costs
- Mechanical installation: Rigging, placement, grouting, piping connections, coupling alignment
- Electrical work: Cable sizing, conduit, terminations, starter/VFD panel integration
- Civil modifications: Foundation upgrades, drainage, containment, access platforms
- Instrumentation: Flow meters, pressure transmitters, vibration sensors, wiring to DCS/PLC
Indirect and Transitional Costs
- Engineering design and project management hours
- Permitting and regulatory notification fees
- Production loss during changeover window
- Training for operators and maintenance personnel on new equipment/controls
- Documentation updates (P&IDs, SOPs, spare parts lists, safety procedures)
- Phased implementation premiums for brownfield retrofits avoiding shutdowns
Retrofit-Specific Considerations
When replacing existing equipment:
- Dimensional compatibility (footprint, shaft height, flange orientation) affects modification scope
- Electrical compatibility (voltage, frame size, starter rating) determines reuse potential
- Control system integration complexity varies by communication protocol support
- Legacy infrastructure constraints (undersized cables, inadequate ventilation) may necessitate ancillary upgrades
Document all assumptions explicitly; installation cost variance between alternatives can reverse TCO rankings for low-hour applications.
6. Step 5: Account for Residual Value and End-of-Life Costs
Though typically small, proper treatment ensures analytical completeness.
Residual Value Estimation
- Scrap Recovery: Metal weight × prevailing scrap commodity price. Motors contain valuable copper; pumps vary by metallurgy.
- Refurbishment/Resale Market: Some standardized frames retain resale value; specialized or obsolete units do not.
- Core Exchange Credits: Vendor take-back programs for rewound motors or rebuilt pumps.
Disposal and Compliance Costs
- Hazardous Material Handling: PCB-containing capacitors (legacy), mercury switches, lead-based paint, contaminated lubricants. Testing and certified disposal add cost.
- Recycling Mandates: WEEE, local e-waste regulations may impose take-back or recycling fees.
- Decommissioning Labor: Safe removal, decontamination, site restoration.
- Data Destruction: Smart motors/pumps with embedded storage require secure data wiping before disposal.
Apply consistent end-of-life assumptions across compared alternatives unless meaningful differentiation exists.
7. Step 6: Conduct Rigorous Sensitivity Analysis
Point estimates conceal risk. Sensitivity analysis reveals which variables drive decision robustness.
Key Variables to Test
| Variable | Typical Range | Rationale |
|---|---|---|
| Energy Price Escalation | 0% – 7% annually | Highest TCO leverage; geopolitical/regulatory uncertainty |
| Annual Operating Hours | ±20% of baseline | Production volume variability; seasonal effects |
| Motor Efficiency Delta | ±1–2 percentage points | Test tolerance; aging degradation; VFD interaction |
| Downtime Cost per Hour | 0.5× – 2× base estimate | Uncertainty in lost production valuation |
| Failure Rate / MTBF | 0.5× – 2× base estimate | Site-specific conditions vs. generic data |
| Discount Rate | 6% – 12% | Corporate WACC variation; project risk premium |
| Maintenance Labor Rate | ±15% | Regional wage differences; outsourcing vs. in-house |
Presentation Formats
- Tornado Diagrams: Rank variables by TCO impact magnitude; identify dominant uncertainties.
- Break-Even Analysis: Identify threshold values where alternative ranking reverses (e.g., "IE4 preferred if operating hours > 4,200/year").
- Probabilistic Monte Carlo Simulation: Assign probability distributions to key inputs; generate TCO confidence intervals rather than single values. Communicates risk quantitatively to stakeholders.
- Scenario Narratives: Define Best Case / Expected / Worst Case scenarios with coherent input combinations (avoid mixing optimistic energy prices with pessimistic failure rates).
Decision Rule: If TCO ranking is stable across plausible sensitivity ranges, proceed with confidence. If ranking flips within reasonable bounds, gather additional data or implement staged investment with validation checkpoints.
8. Decision Criteria and Non-Monetary Factors
Financial Metrics
- Net Present Value (NPV): Preferred metric; discounts future cash flows to present value using corporate hurdle rate. Positive NPV indicates value creation. Compare NPV differences between alternatives.
- Internal Rate of Return (IRR): Useful for capital budgeting prioritization; compare against minimum acceptable return threshold. Beware multiple IRR solutions for non-conventional cash flows.
- Simple Payback Period: Intuitive but ignores time value of money and post-payback savings. Acceptable only as supplementary screening metric.
- Levelized Cost of Service: Annualized TCO divided by annual output (m³ pumped, tons processed). Enables cross-application benchmarking.
Strategic and Qualitative Overlay
Financial metrics necessary but insufficient. Integrate:
- Safety Risk Differential: Inherently safer designs justify TCO premium; quantify where possible through insurance and incident cost avoidance.
- Regulatory Compliance Trajectory: Equipment meeting anticipated future standards avoids premature obsolescence and retrofit costs.
- Supply Chain Resilience: Vendor financial stability, geographic diversification, spare parts availability, and technical support responsiveness.
- ESG Alignment: Carbon reduction contributions, circular economy attributes, community/social license considerations.
- Operational Flexibility: Wide operating envelope, turndown capability, future expansion accommodation.
- Knowledge Transfer and Training Burden: Familiarity reduces human error risk; exotic technologies carry learning curve costs.
Document qualitative factors explicitly alongside financial analysis; avoid hidden weighting that undermines analytical transparency.
9. Practical Application: Comparative TCO Example
Scenario Definition
Centrifugal pump serving continuous industrial cooling loop. Two motor options evaluated:
| Parameter | Standard Motor (IE2) | Premium Motor (IE4) |
|---|---|---|
| Rated Power | 75 kW | 75 kW |
| Purchase Price | USD 4,500 | USD 7,200 |
| Nameplate Efficiency | 93.0% | 95.8% |
| Weighted Avg. Efficiency (actual load profile) | 91.5% | 94.8% |
| Expected Bearing Life (L10h) | 40,000 h | 60,000 h |
| Annual Operating Hours | 8,000 | 8,000 |
| Average Load Factor | 78% | 78% |
| Electricity Cost | USD 0.12/kWh | USD 0.12/kWh |
| Energy Escalation | 3%/year | 3%/year |
| Analysis Period | 15 years | 15 years |
| Discount Rate | 8% | 8% |
Simplified Annual Energy Savings
Shaft power = 75 kW × 0.78 = 58.5 kW
- IE2 Input Power = 58.5 / 0.915 = 63.93 kW
- IE4 Input Power = 58.5 / 0.948 = 61.71 kW
- Power Difference = 2.22 kW
- Annual Energy Savings = 2.22 kW × 8,000 h = 17,760 kWh
- Year 1 Cost Savings = 17,760 × USD 0.12 = USD 2,131
With 3% escalation discounted at 8%, 15-year NPV of energy savings ≈ USD 21,800.
Incremental Investment and Payback
Price premium = USD 7,200 − USD 4,500 = USD 2,700
Simple payback = USD 2,700 / USD 2,131 ≈ 1.3 years
NPV of premium investment = −USD 2,700 + USD 21,800 = +USD 19,100
Extended TCO Considerations
- Reduced bearing replacement frequency (60k vs. 40k hour L10): ~USD 800 NPV maintenance savings
- Lower heat rejection to cooling system: secondary energy benefit (site-specific)
- Higher resale/scrap value due to copper content and marketability
- Regulatory future-proofing against tightening efficiency mandates
Conclusion: Despite 60% higher purchase price, IE4 motor delivers overwhelmingly superior TCO. Decision robust across all plausible sensitivity ranges. This pattern holds for most continuous-duty industrial applications; intermittent or low-hour duties require case-specific validation.
10. Implementing TCO as Organizational Capability
Institutionalize the Process
- Embed TCO templates in procurement SOPs and RFQ evaluation criteria.
- Train buyers and engineers on methodology; avoid black-box calculator dependency.
- Maintain centralized duty cycle and failure rate databases updated from CMMS/SCADA.
- Require TCO justification for all purchases exceeding defined thresholds.
- Conduct post-installation validation comparing projected vs. actual TCO; calibrate models iteratively.
Technology Enablement
- Integrate TCO calculators with ERP/CMMS for automated data population.
- Deploy digital twin models for complex system-level optimization beyond component TCO.
- Use IoT telemetry to validate operating assumptions and trigger recalibration.
- Benchmark TCO outcomes across sites and asset classes to identify systemic improvement opportunities.
Supplier Partnership Model
Engage suppliers as TCO co-analysts rather than adversarial bidders:
- Share duty data and receive customized efficiency/load modeling.
- Request validated test reports supporting efficiency and reliability claims.
- Negotiate performance guarantees tied to TCO outcomes.
- Collaborate on application-specific optimization beyond catalog offerings.
11. TECHO Electrical & Mechanical: TCO-Analytic Partnership for Optimal Outcomes
TECHO Electrical & Mechanical (Taizhou) Co., Ltd. recognizes that our customers’ success is measured in lifecycle value, not unit sales. We have invested in TCO modeling capabilities and application engineering resources to support evidence-based procurement decisions.
Our TCO Support Services
- Custom TCO Modeling: Provide your duty data and receive detailed, transparent lifecycle cost comparisons across TECHO and competitor options. All assumptions documented; models auditable.
- Application-Specific Efficiency Validation: Tested performance data under realistic load profiles, not just nameplate ratings. VFD interaction effects included.
- Reliability Data Transparency: Field-derived MTBF/MTTR statistics by application category; honest discussion of limitations and site-specific adjustment factors.
- Retrofit Feasibility Assessment: Installation cost estimation, dimensional compatibility checks, and transitional risk identification for brownfield upgrades.
- Post-Installation Performance Verification: Optional M&V protocols validating projected savings; model recalibration based on actual operating data.
- Regulatory Future-Proofing Guidance: Product roadmap alignment with anticipated efficiency and environmental standards; obsolescence risk assessment.
Request Your TCO Analysis
Submit your application parameters and receive a comprehensive, no-obligation TCO comparison within five business days. Our engineering team will work with you to refine inputs, validate assumptions, and interpret results in the context of your specific operational and financial objectives.
Visit www.cntecho.com to access TCO request forms, download calculation templates, or schedule a consultation with our application engineers.
Disclaimer: TCO calculations are estimates based on provided inputs and stated assumptions. Actual results depend on installation quality, operating conditions, maintenance practices, and external factors beyond manufacturer control. This guide provides methodological framework and does not constitute financial advice. Validate critical decisions with qualified professionals and site-specific data. All monetary examples are illustrative; use actual local costs and conditions.